Measurable Progress
Committed to Our Future
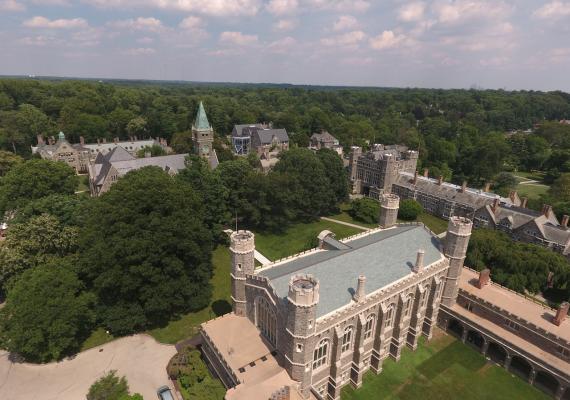
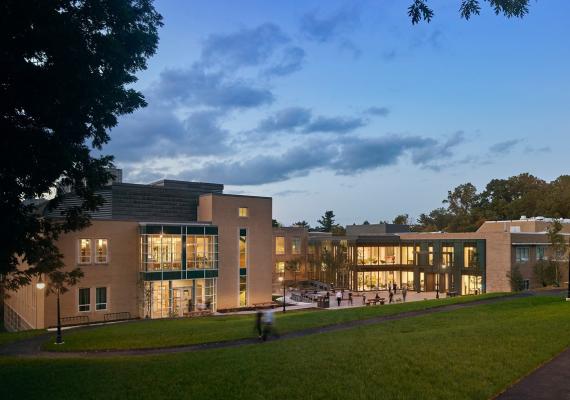
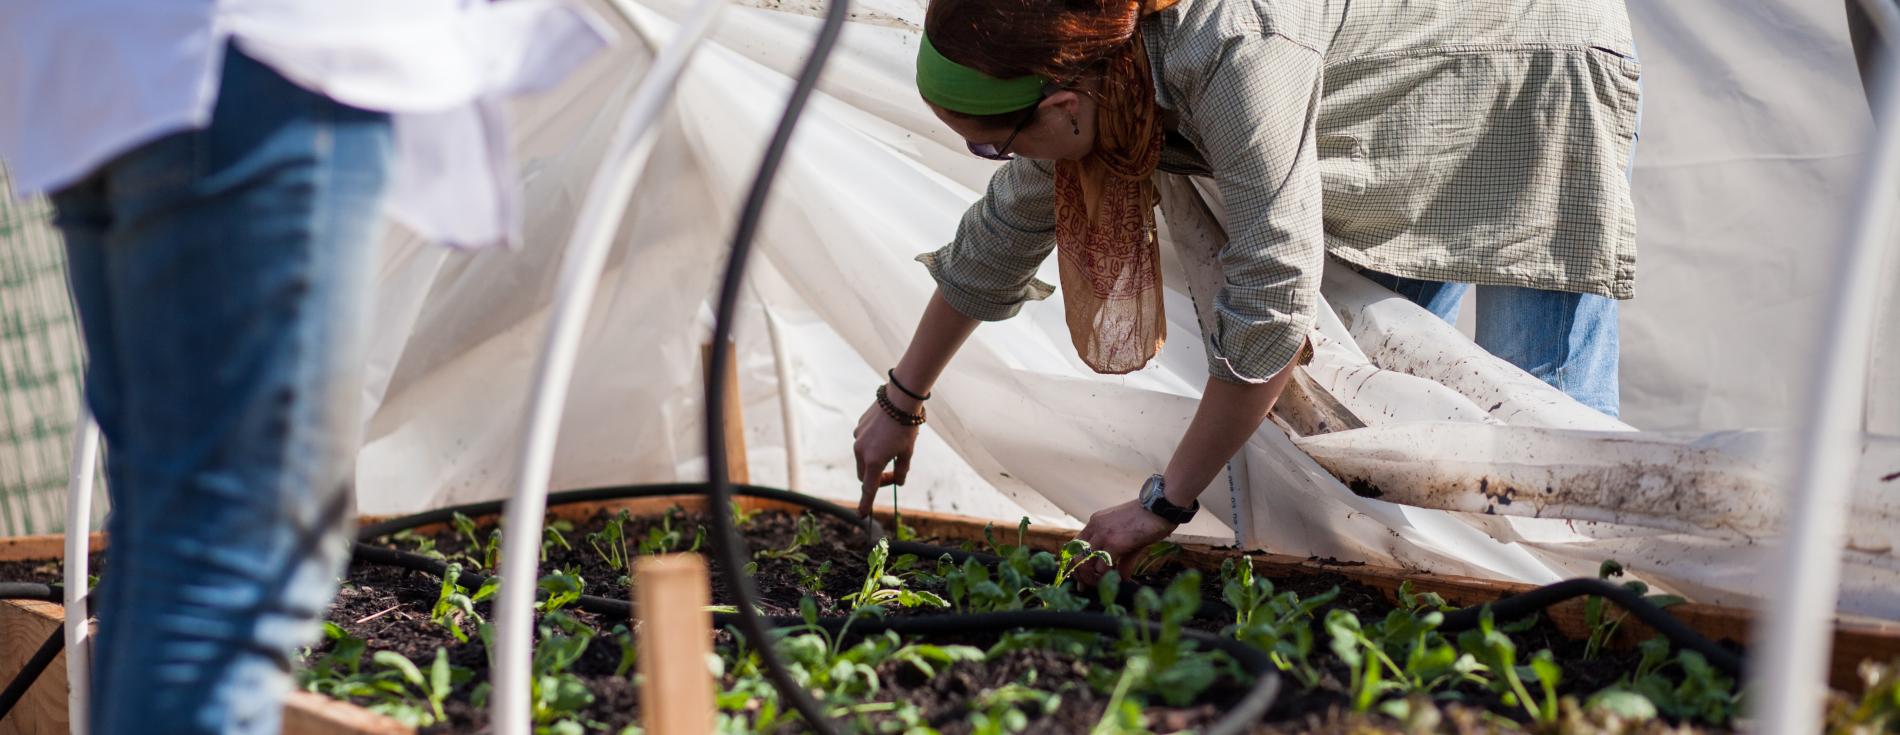
Bryn Mawr College is committed to environmental sustainability, and views sustainability as vital to the College’s mission as a socially responsible institution.
Net Campus Emissions
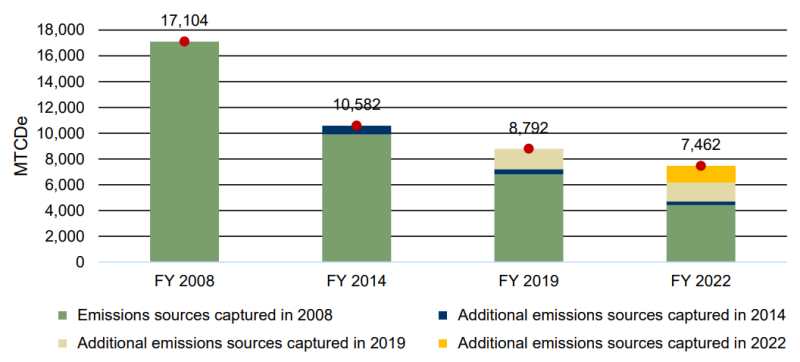
The chart below depicts Bryn Mawr College's net campus emissions, showing additional emissions categories by year.
Explanation of Chart
This chart is a vertical bar graph. The vertical axis of the chart shows Metric Tons of Carbon Dioxide Equivalents (MTCDe), ranging from 0 MTCDe to 18,000 MTCDe, in increments of 2,000. The horizontal axis shows four fiscal years: 2008, 2014, 2019, and 2022, and each year shows a vertical bar, segmented by color to represent emissions measured in that year.
Each vertical bar in the graph is segmented into colors. In 2008, certain emissions sources were measured. Those sources were also measured in 2014, 2019, and 2022 and are represented by the color green. In 2014, additional sources were measured and are represented in the 2014, 2019, and 2022 bars by the color blue. In 2019, additional sources were included in the measurement, and are represented in the 2019 and 2022 bars by the color tan. Finally, in 2022, even more sources were measured and are represented by the color yellow.
In 2008, the total emissions measurement was recorded at 17,104 MTCDe.
In 2014, the total emissions measurement was recorded at 10,582 MTCDe.
- 5.2% annual reduction between 2008 and 2014
- 31.1% reduction since 2008
In 2019, the total emissions measurement was recorded at 8,792 MTCDe.
- 3.4% annual reduction between 2014 and 2019
- 16.9% reduction from 2014
- 48.8% reduction since 2008
In 2022, the total emissions measurement was recorded at 7,462 MTCDe.
- 5.0% annual reduction between 2019 and 2022
- 15.1% reduction from 2019
- 56.4% reduction since 2008
- 72.4 % reduction since 2008 counting only the emissions measured in 2008
Sources Measured in 2008, 2014, 2019, and 2022 (green on the chart)
- On-Campus Stationary
- Direct Transportation
- Purchased Electricity
- Commuting
- Directly Financed Air Travel
- Solid Waste
- T&D Losses
Additional Sources Measured in 2014, 2019, and 2022 (blue on the chart)
- Paper Purchasing
- Study Abroad Travel
Additional Sources Measured in 2019 and 2022 (tan on the chart)
- Refrigerants & Chemicals
- Fertilizer & Animals
- Waste Water
- Food
Additional Sources Measured in 2022 (yellow on the chart)
- FERA
Highlighted Greenhouse Gas Offsets
Various on-site and off-site projects can be used to reduce an organization’s gross greenhouse gas emissions. The College is currently engaged in a number of offset projects, some of which are highlighted below.
Renewable Energy Credits (RECs)
In 2022, Bryn Mawr purchased 15,915 MWhs of Green-e certified Wind RECs, meeting the environmental standards established by the non-profit Center for Resource Solutions.
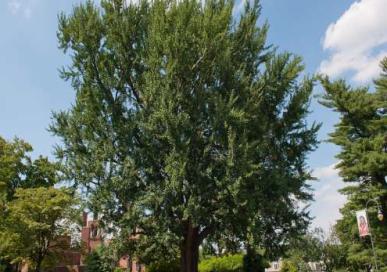
Preservation of Trees
In 2019, a detailed assessment recorded 1,298 large trees on campus and an additional 1,702 trees located in our preserved Morris Woods area of campus, accounting for a 37 MTCDe carbon offset.
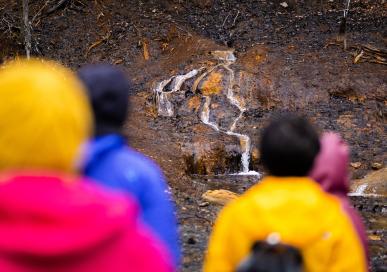
Carbon Offset Efforts
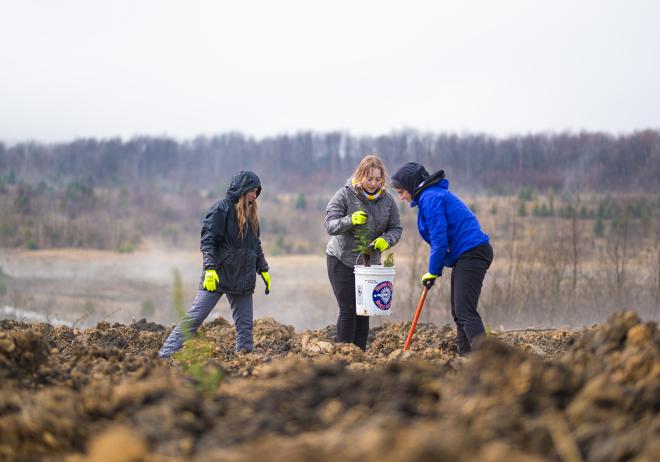
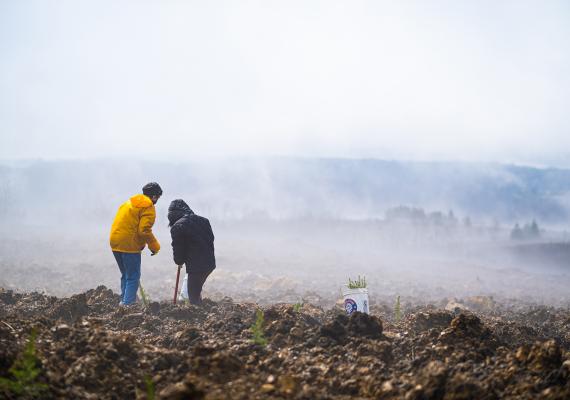
In 2022, the College mitigated 266.5 MTCDe through a partnership with the Pennsylvania Environmental Council to plant trees in Blair County, PA. In five years, that mitigation will increase to 1,005 MTCDe.
Planting 400,000 Trees
The College has partnered with the Pennsylvania Environmental Commission to plant up to 400,000 trees on legacy mine lands during the next five years and more than 98,000 trees have been planted as of April 2023.